
- Tue Dec 08, 2020 8:12 pm
#370354
 Figure4.png (1.07 MiB) Viewed 3352 times
Figure3.png (17.46 KiB) Viewed 3352 times
Figure2.png (610.72 KiB) Viewed 3352 times
Figure1.jpg (762.84 KiB) Viewed 3352 times
Figure4.png (1.07 MiB) Viewed 3352 times
Figure3.png (17.46 KiB) Viewed 3352 times
Figure2.png (610.72 KiB) Viewed 3352 times
Figure1.jpg (762.84 KiB) Viewed 3352 times
Abstract:
Carnivorous plants are a diverse group of plants that are able to exploit different niche-spaces than typical plants due to their ability to capture small, typically arthropod prey. Drosera, the sundews, are widely distributed throughout Australia and found in a diverse group of habitats. We asked the question how environmental parameters and species range have affected morphological characteristics. By measuring morphological characteristics of six species and used climatological data, we were able to model niche-spaces and associate different morphologies with varying niche-spaces. It was found that several climatological parameters influenced the range of each species, and also determined the morphological characteristics of each species. We also noticed instances of putative niche-partitioning between sundews in Sects. Bryastrum and Lasiocephala. It was also found that humidity, rainfall, and temperature all had statistically significant effects on the morphologies of the species studied. Furthermore, our study reveals that the species in Sects. Bryastrum and Lasiocephala differ in response to different ecological parameters, with a more We also hypothesized different morphologies that complicate interspecific competition and niche-spaces, including gemmae, the loss of carnivory, and different growth habits. We conclude that it is likely that most Australian Drosera is affected by micro-and macro-climatological parameters.
Introduction:
Carnivorous plants are one of the most notable groups of plants due to their unique ability to digest other organisms, or in some cases substances, to obtain nutrients. They typically attract, catch, and digest prey by using modified structures called traps. Carnivory is observed in several orders, notably Droseraceae, Sarraceniaceae, and Lentibularaceae, which have been shown to have evolved independently to carnivory (1).
Carnivorous plants exist on every continent except Antarctica, and over 750 extant species of carnivorous plants have been described, indicating that carnivory is not an anomaly, rather, it is a successful strategy that increases a species’ fitness. Several species are also recognized as protocarnivorous, hinting that carnivorous habits lie on a spectrum, ranging from completely autotrophic, to majorly heterotrophic. Certain species in the genus Ibicella, for example, have been shown to be able to catch and immobilize prey, while no evidence of nutrient absorbance has been discovered (CITATION). Roridula is a genus shown to be able to digest nutrients through sticky tentacles on its leaves, but it requires symbiotic assassin-bugs (Rorida sp.) to digest its prey (citation). For the purposes of this paper, the phrase ‘carnivorous plants’ refers to a plant that is able to catch, immobilize, and digest prey without any external aid.
The evolution of carnivory has allowed carnivorous species to live in nutrient-poor soils because they are able to obtain crucial nutrients (N, P, and K) from prey or other organic matter (2). It has been suggested that carnivory is a cost-benefit model, in which plants attempt to balance between photosynthetic and heterotrophic functions. Recent studies have demonstrated that increased prey capture may result in more efficient photosynthesis in carnivorous plants (https://pubmed.ncbi.nlm.nih.gov/19454591/) and that energy investment on carnivory varies with the nutrients present in the soil (https://pubmed.ncbi.nlm.nih.gov/31402798/). It follows that, depending on where a species is spatially located, as well as according to the prey targeted, that each species will have different morphologies and strategies for trapping prey.
Carnivorous plants, thus, occupy different niches by specializing on different types of prey through various trap morphologies and attractants. For example, corkscrew traps found in Genislea allow it to easily capture microorganisms, while the ciliate pitchers of Heliamphora can catch larger insects (3). Unique trapping structures allow different carnivorous plants to capitalize on different sources of energy, causing less competition. In certain genera, morphologies are quite varied, for instance, in the genus of pitcher-plants, Nepenthes. Nepenthes lowii is a primarily coprophagic plant, Nepenthes inermis acts as a sticky trap instead of a pitfall trap, and Nepenthes ampullaria obtains a large amount of its nutrients from decaying plant matter that falls into its pitchers. This demonstrates that drastically different adaptations exist to allow carnivorous plants to obtain nutrients from prey or other organic matter.
Drosera, commonly known as sundews, are known to possess glanduliferous tentacles on their leaves to capture, immobilize, and digest prey (2). This genus presents many different trap morphologies, including several different types of tentacles (2). It has been hypothesized that the genus Drosera originated in Australia; now Drosera are found on every major landmass except Antarctica (Citation needed). Further complicating the phylogeny of Drosera, putative cases of long-distance dispersal have been hypothesized, for example in the Venezuelan species Drosera meristocaulis (Cite the Meristo paper). Over fifty species of Drosera are found in Australia, spread in several Sections (Sects). Since Drosera likely originate from Australia, and Australia’s wide range of ecosystems and microhabitats present a unique opportunity for diversification and niche-partitioning, we decided to study Australian sundews for this study.
The genus Drosera contains several sections, including Sects. Bryastrum and Lasiocephala, which both share a common ancestor, and are both endemic to Australia (6).. Many of the species described in both Sect. Bryastrum and Sect. Lasiocephala are under-documented, and very few instances in GBIF (Global Biodiversity Information Facility) have been recorded of D. caduca and D. falconeri (n=12 and n=30, respectively).
The species in Sect. Lasiocephala, originating from tropical grasslands in the north of Australia, are known to be able to inter-hybridize, producing fertile hybrids, a phenomenon not commonly seen (Citation needed). It is thus possible that several species in this clade are of hybrid origin. Certain species in sect. Lasiocephala are also known to have weak species-defining characteristics, further complicating the genetic history of the clade. Furthermore, the species in sect. Lasiocephala all have similar growth habits, including semi-erect rosettes and subpeltate trap insertions except for D. falconeri, which is known for its large, flat traps, and prostrate growth habit (Lowrie CITATION NEEDED RICE). Such overlap in morphology and growth habits presents a unique opportunity to study subtle morphological variations, and to correlate them with ecological parameters, in order to postulate a relationship between the two.
The members of Sect. Bryastrum, however, occur in the south of Australia, in a Mediterranean chaparral biome. Commonly known as ‘pygmy sundews’ due to their diminutive size, often smaller than 2cm across, this clade possesses several characteristics that set it apart from other Drosera. The species are known to readily propagate asexually by gemmae, and are less fecund than other species of Drosera. They also possess long, thin, red roots, which penetrate the soil deeply and anchor the plant to the ground quite firmly. Furthermore, when compared to the stipules in Sect. Lasiocephala, the stipules found in Sect. Bryastrum’s species are quite prominent. Despite these distinctive characteristics, preliminary genomic analysis using MEGA-X software suggests that Sect. Lasiocephala is a daughter of Sect. Bryastrum.
Six species were chosen for the experiment, from Sect. Bryastrum (B) and Sect. Lasiocephala (L). The species used were Drosera paleacea (B), Drosera leucoblasta (B), Drosera caduca (L), Drosera falconeri (L), Drosera ordensis (L), and Drosera petiolaris (L).
We investigated the correlations between environmental parameters and plant morphologies, to test if there were any significant climatological factors influencing plant morphologies and species range in Sects. Bryastrum and Lasiocephala, which could have implications for speciation in both sections. We hypothesized that rain, humidity, solar radiation, UV index, and sunlight intensity would significantly affect the species distribution patterns and morphological characteristics of each species.
Results:
Multiple Linear regressions were carried out in R and reported, along with the adjusted multiple r2 values (Table 2). Relative humidity was the most significant predictor for each morphology, (t-test, p<0.001 for all samples), followed by average rainfall (t-test, p<0.05 for all samples).
Lastly, a NMDS (Non-Metric Multidimensional Scaling) plot was created based off the morphological characteristics of each species (Figure 3). The NMDS plot reveals that the morphological characteristics of D. paleacea, D. falconeri, D. caduca, and D. petiolaris are more similar, while D. leucoblasta and D. ordensis are more distant (Figure 3).
Discussion:
Our study aimed to identify factors associated with divergence within the monophyletic clade formed by Sect. Bryastrum and Lasiocephala. To accomplish this aim, ‘type’ specimens of each species were measured for selected morphological characteristics; publicly available climatic data was then used to carry out niche modeling with distributional data taken from GBIF. We initially hypothesized that each of the selected climate conditions played a role in shaping morphological characteristics and therefore, speciation; this hypothesis was only partially supported by the data. We reported a statistically significant MANOVA score of the morphological characteristics, and each species exhibited clear distribution patterns, as modelled by MaxEnt software.
Environmental conditions affecting morphology:
Humidity appears to play a role in determining morphological characteristics, and it was the third-most important factor besides precipitation and frost days for determining range (Table 2, Table 3). The regression equation for tentacle density included humidity, and was statistically significant, (r2 = 0.495, p<0.01). Since Drosera employ glandular tentacles to capture and attract prey, and the tentacles constantly exude a sweet and sticky substance to attract and capture prey, it is likely difficult to maintain high densities of tentacles in arid areas. While a plant may possibly produce less tentacles to avert losing water, it must also provide itself with enough nutrients to offset the energy costs of the tentacles. Higher humidities could allow a plant to make more tentacles per given area, as the plant could lose less water due to lower rates of evapotranspiration. Conversely, plants in more arid environments may be more likely to have less tentacles and less dew, because the lack of humidity may not allow the plant to obtain enough water to support dew production. This hypothesis is supported by our linear regression models, which predict that for every percent of humidity, the number of tentacles per square centimeter increases by 29.5 (Table 2).
D. ordensis was removed from the other sundews on the NMDS plot of morphological characters (Figure 3). This placement is likely driven by the large number of trichomes on the lamina, on average 3435 per square centimeter of leaf (Table 1). The trichomes likely prevent water loss through evapotranspiration, and potentially allow the plants to use water from fog and dew. D. ordensis’ estimated species range overlaps with D. petiolaris, and they both possess a similar trap structure, so they are likely to capture the same prey (Figure 2, Figure 5). Interestingly, while the species range of both species overlaps, MaxEnt models show D. ordensis hotspots where D. petiolaris probabilities are low, and significant D. petiolaris hotspots where D. ordensis probabilities are low. It may be that the evolution of dense trichomes in D. ordensis allowed this species to capitalize on different microhabitats, likely in warmer areas, avoiding competition with D. petiolaris for the same prey sources. It is thus likely that competition for prey sources is common in areas with many species of sundew, so other Sects. of sundews also likely have evolved different mechanisms to live in areas inhospitable for the competing species.
A recently discovered species, Drosera stipularis, is characteristic of both sundews in Sects. Bryastrum and Lasiocephala (9) (Figure 4). The species forms a prominent stipule cover over the main bud, and measures approximately two centimeters across (9). It inhabits exposed sand-pockets on dunes, more similar to the sundews in Sect. Bryastrum, whereas the sundews in Sect. Lasiocephala enjoy moist to inundated soil in sedges and woodlands (9). D. stipularis most likely D. stipularis may demonstrate that smaller sundews prefer more light, and evolve long, prominent stipules to prevent desiccation in such exposed environments. Drosera meristocaulis, a sundew reminiscent of those in Sect. Bryastrum, was hypothesized by researchers to be in a clade sister to the species in Sect. Bryastrum. D. meristocaulis, being located in drier regions of the Neblina massif, faces similar conditions to the species in Sect. Bryastrum. The researchers claim that this likely enforced the characteristics of D. meristocaulis to keep its reminiscent characteristics while having been separated from the Australian sundews for a relatively long time. These findings are likely applicable to D. stipularis, whereby a dry, changing climate enforces Bryastrum-like morphological characteristics.
For both sundews tested in Sect. Bryastrum, solar radiation was relatively important to the MaxEnt model (Table 3). The sundews from this section are spatially located in the South of Australia, where water is scarcer, and the sun is and the sun is very direct during spring and early summer, during their season of active growth. Because most species in Sect. Bryastrum do not exceed 1 centimeter across, there is little photosynthetic area on the plant. High amounts of solar radiation may be needed to allow enough photosynthesis for growth of the traps and production of dew, given the small size of the plants. Conversely, too much photosynthetic area on the plant would likely increase the amount of water needed to sustain growth and turgor pressure. Similarly to D. stipularis, many species in Sect. Bryastrum exhibit a stipule bud, likely to prevent desiccation during the late-summer dormancy characteristic of several species when the solar radiation is at its peak. It is also likely that the stipules shield the site of active cell differentiation from the sun, blocking most of the harmful UV rays that might enter the dividing tissue at the meristem.
Unique morphologies allowing occupation of unique niches :
D. falconeri’s predicted range is found overlapping with a hotspot in D. petiolaris’ putative distribution (Figure 2). D. falconeri has a drastically different growth habit and structure from D. petiolaris, with very dense, short tentacles on large traps, while D. petiolaris is more erect and has small, cupped traps with long tentacles (Table 1). Erect sundews have been shown to more likely catch aerial prey, and prostrate rosettes have been shown to more likely catch ground-dwelling prey (7). It is likely that the large, planar leaves of D. falconeri likely touch the soil surface, and this hypothesis is further bolstered by the presence of a large number of trichomes on the adaxial surface of the leaves and traps. A planar trap at the surface of the soil seems most advantageous for larger walking prey and the especially dense carpet of tentacles would allow the plant to come in contact with a large area of its prey, allowing for easier entrapment and more tentacles to digest the nutrients. D. petiolaris’ traps, contrarily, are small, with long tentacles, and are held in the air. These traps are unlikely to catch any ground-dwelling prey, and the cupped shape may allow more efficient capture of flying prey, discussed later. Thus, it is very reasonable that the differences in trap-shape allow both species to coexist with limited interspecific competition, due to the capture of different types of prey.
D. caduca is named for its characteristic loss of traps in the adult phase, a phenomenon only seen in this single species (13). It only forms traps during the seedling phase, or directly after the plant emerges from dormancy. The species also possesses contractile roots, not seen in any other in Sect. Lasiocephala. The loss of traps and storage organ (contractile roots) allude that the sundew likely stores nutrients from captured prey, and does not need to replenish the supply of stored nutrients very often, only following periods of new growth post-dormancy. It is thus plausible to conclude that this species is evolving away from carnivory, however there are many possible reasons for this phenomenon. One hypothesis is that D. caduca’s loss of tentacles and carnivorous habit is due to interspecific competition with D. petiolaris, which exhibits many similar morphological characteristics, including tentacle length and trap size (table 1). An interesting observation to note was that while D. petiolaris had a tentacle density of 554, D. caduca had a tentacle density of just 65 (Table 1). It could be that traps with more tentacle density are more efficient in trapping prey, and the difference in tentacle density caused D. caduca to lose its traps. It could also likely be that as a result of competition, D. caduca was not able to offset the energy costs of maintaining a high tentacle density, and through interspecific competition, gradually evolved less tentacle density, until reaching the ‘equilibrium point’ where the expected gains from prey capture are greater than the expected energy loss from producing “dew” on the traps.
Furthermore, the erect species D. caduca, D. ordensis, and D. petiolaris all possess very long tentacles, likely to trap prey flying by the trap (Table 1, CITATION https://www.ncbi.nlm.nih.gov/pmc/articles/PMC3907454/). D. falconeri, conversely, has very short tentacles, probably to allow walking insects to easily be trapped, and gluing them close to the leaf, where they are not likely to escape, as discussed above. Species with different tentacle lengths can likely overlap in range as they occupy different predatory niches. Interestingly, this is seen only in two examples of the species studied – D. petiolaris and D. falconeri, and D. paleacea and D. leucoblasta (Figure 2, Table 1). An example of this working inversely, D. caduca and D. ordensis’ distributions overlapped, with tentacle sizes roughly identical, and D. caduca loses its traps once it matures, as it is likely moving away from carnivory. It is thus very plausible that tentacle length is a major point of differentiation for the sundews in both sections studied. The tentacle length was demonstrated to have a weak, linear correlation with trap size, implying that trap morphologies other than tentacles were also important to speciation in Drosera.
It has also been demonstrated that plants with cupped traps in Sect. Lasiocephala push insects glued to tentacles onto the medial surface of the trap, using their long, aerial-prey-optimized tentacles, potentially enabling the plant to catch stronger prey that can potentially escape from the trap. The Venus Flytrap (Dionaea muscipula) possesses a unique bear-claw trap that closes around prey to secure prey and ensure proper digestion, comparable to cupped traps (8). Similar to the D. muscipula, the curved surface of the trap may allow more surface area for digestion, and provide a secure containment for captured prey. Thus, the species with cupped traps may be able to catch stronger and larger prey due to their unique trap shapes, potentially allowing them catch different types of prey and avoid competition with other species. A cupped trap allows for more surface contact with the prey, allowing more of the insect to be digested, allowing the plant to leach more nutrients from its prey. Furthermore, other species of Drosera exhibit a thigmotropic response, utilizing the entire leaf to fold and curl around prey items (CITATION). A cupped trap eliminates the need for such a dramatic response, instead using tentacles to push the prey into the trap. Thus, is likely that a cupped trap benefits these plants from an energy-optimization perspective, but at the moment, there is no existing research to prove any of these hypotheses. Studies of the enzymes produced by these plants might allow us to determine how morphologies such as cupped traps arose, discussed later.
The species of Sect. Bryastrum all produce gemmae, small bundles of undifferentiated cells, that are able to clonally propagate once dispersed by raindrops or wind (CITATION). At the advent of winter, once temperatures begin to cool, the gemmae begin forming at the apical meristem of the plant, and new growth halts temporarily (Figure 6 NEW FIGURE ). The gemmae eventually tightly pack together, causing high pressures, and are dispersed once disturbed by a raindrop, scattering in the surrounding soil. The presence of gemmae is unique to Sect. Bryastrum, and species producing gemmae allocate a large proportion of N and P towards producing gemmae (https://www.publish.csiro.au/BT/BT9920353). This indicates that gemmae are a highly successful strategy for asexual propagation in Sect. Bryastrum. Furthermore, the production of gemmae means that more successful clones of a single species could out-compete other clones of the same species, possibly causing less species variation. With the ability to create greater than 30 gemmae per plant, interspecific competition may be further complicated by successful clones dominating inferior plants in situ. Perhaps, due to the high amount of energy required to produce gemmae, more successful predatory plants are able to obtain more energy and thus produce more gemmae, selecting for the plants which catch prey more effectively. Such competition could cause species to be hyper-adapted to their environments and the specific species they aim to catch, allowing each species to potentially exploit its own micro-niche.
Limitations and further implications.
This study’s morphological evidence was limited in that only one plant of each species from Sect. Lasiocephala was used, as we did not have access to a large number of these plants. The specimens used were also ‘type’ specimens, meaning that we could not capture regional diversity in morphologies found within wild variants of the species. In future studies, it would be advantageous to use several plants from different locations, in order to capture variations in morphology. Another factor is that most of the plants in cultivation are generally more vigorous forms that are able to tolerate horticulture. Thus, in using horticultural specimen plants, we likely inadvertently studied some of the hardiest plants from each species. This could be averted in future studies by using plants randomly selected from the wild.
For the species in Sect. Bryastrum, a significant area in the southeast of Australia and on Tasmania was predicted as highly likely species range by MaxEnt modelling. Unlike D. caduca, we had several instances of data for both of the species studied. This likely implies that there are other ecological parameters beyond the scope of this study that have an influence on Drosera species distribution. Further studies would help elucidate what parameters these are.
The MaxEnt results discussed may be an appropriate starting point for further field studies to determine the true range of each species. D. caduca only had 12 coordinate occurrences in GBIF, limiting this study. Further field studies may help us build our knowledge about species’ in situ interactions with insects and arachnids, as well as helping us pinpoint the actual ranges of each species studied. Analyzing the enzymes in the mucilage on the tentacles may also allow us to learn more about what each species is capable of digesting, and might shed new light on the factors driving speciation. These results could likely also have implications for determining morphologies that aid in insect capture – if certain enzymes are found with certain trap morphologies, it could be conjectured that a certain trap is optimized for a certain prey.
Lastly, one of the species studied, Drosera caduca, presents to biologists a rare phenomenon – a plant moving away from carnivory. Many species are considered ‘protocarnivorous’ and thought to be moving towards carnivory, such as Stylidium sp., Roridula sp., and Ibicella sp. Understanding how and why D. caduca is moving away from carnivory may also allow us insight into how carnivorous plants evolve the morphologies and enzymes needed for capture and digestion of prey. By analyzing the factors causing D. caduca to leave carnivory, further studies could provide clues to the factors encouraging plants to develop unique mechanisms to capture insects and other prey.
Conclusion:
In conclusion, certain environmental characteristics, including relative humidity, temperature, and rainfall, are significantly associated with morphological characteristics of species in Sects. Lasiocephala and Bryastrum. Through allowing species to inhabit different predatory niches and establish in new environments, morphological adaptations may have encouraged divergence with this clade. Similarly, morphological characteristics have allowed species to occupy different predatory niches, to avoid competition. In some cases, however, competition results in a loss of species diversity or evolution away from carnivory. The effects of environmental parameters, as demonstrated by our work, can likely be applied to all Australian species of Drosera, allowing us to better understand how and why carnivorous plants evolved.
Materials and Methods:
MEGA-X software was used to visualize the clade of Drosera and choose which species to use for the experiment (15). RbcL (plant plastid) sequences of many Drosera were downloaded from the NCBI NucCore, all of which had introns and stop codons removed. MEGA-X was used to align the sequencing data prior to constructing a phylogenetic tree. To build the phylogenetic tree, we utilized the Jukes-Cantor model, and one-hundred repetitions of bootstrapping was used to confirm the phylogenetic tree (16). The MEGA- X tree was used to select species to use for the study.
Based upon our results, we chose the six species from Sect. Bryastrum (B) and Sect. Lasiocephala (L). The species Drosera paleacea (B), Drosera leucoblasta (B), Drosera caduca (L), Drosera falconeri (L), Drosera ordensis (L), and Drosera petiolaris (L) were used for this study.
Specimens of D. paleacea, D. leucoblasta, D. caduca, D. falconeri, D. ordensis, and D. petiolaris were grown in a polycarbonate tank, under a 12 hour photoperiod beneath a 4000k CFL lighting system emitting 10,000 lux, in a 2:2:1:1 soil mix of Canadian peat moss, course horticultural perlite, #12 mesh silica sand, and milled Chilean long-fibered sphagnum moss. Humidity was maintained at 100% RH, and temperature was maintained at a constant 24 degrees Celsius. The plants were all grown in 3-inch pots, and were kept sitting in 1cm of water at all times. Prior to this experiment, the plants grew for three months in the grow-chamber in order to remove any non-genetic plant morphologies that were caused by microclimate.
The plants were photographed with a DSLR (Nikon) next to a standard millimeter ruler, to provide a scale for image processing software. Using ImageJ software, the trap area was measured with a polygon tool, on ten randomly selected traps on the plant (17). On another set of ten randomly selected traps, a square measuring 0.5mm x 0.5mm was randomly placed onto a random area of the trap. The square was saturated by 0.9%, and all of the tentacles on the trap were counted. To measure trichomes, the same procedure was repeated on the laminae of plants, on the adaxial side. Lamina width was measured by randomly selecting 10 leaves and measuring the width of the lamina at its widest point. Lastly, tentacle length was measured by randomly selecting another 10 leaves, and counting 10 randomly-selected tentacles on each leaf. The averages of each leaf’s tentacle length were recorded.
Location data was determined using GBIF (18). Raster files were downloaded from the Australian Bureau of Meteorology, for 9am relative humidity (%), actual evapotranspiration (mm/year), average temperature year-round (*C), average rainfall (mm), potential frost days (days), average solar radiation (GJ/M^2/year), and UV index (Index). The raster files were processed in Qgis (19), and data was selected at each location point specified by GBIF.
MaxEnt niche modelling software was used to determine potential spatial locations for all of the species (20). Using Qgis, the raster files were aligned, and the data was put into MaxEnt. The outputs of MaxEnt were used to quantify the response of the species range to different variables, and to determine potential locations of the species. Using R, multiple regression analyses of the morphological characteristics and temperature was also carried out, to determine a species’ morphological response to the different meteorological parameters we used. NMDS modelling was done using Package Vegan (21).
References:
1. Fukushima, Kenji, et al. “Genome of the Pitcher Plant Cephalotus Reveals Genetic Changes Associated with Carnivory.” Nature Ecology & Evolution, vol. 1, no. 3, 2017, doi:10.1038/s41559-016-0059.
2. Plant Biology Greenhouse, University of Illinois,
www.life.illinois.edu/plantbio/greenhou ... orous.html.
3. Ellison, Aaron M., and Nicholas J. Gotelli. “Energetics and the Evolution of Carnivorous Plants—Darwin's ‘Most Wonderful Plants in the World.’” Journal of Experimental Botany, vol. 60, no. 1, 2009, pp. 19–42., doi:10.1093/jxb/ern179.
4. Adamec, Lubomír. “Functional Characteristics of Traps of Aquatic Carnivorous Utricularia Species.” Aquatic Botany, vol. 95, no. 3, 2011, pp. 226–233., doi:10.1016/j.aquabot.2011.07.001.
5. Jordan, Sean M. R., et al. “Quantifying the Effects of the Break up of Pangaea on Global Terrestrial Diversification with Neutral Theory.” Philosophical Transactions of the Royal Society B: Biological Sciences, vol. 371, no. 1691, 2016, p. 20150221., doi:10.1098/rstb.2015.0221.
6. “Drosera Phylogeny.” Drosera Phylogeny | ICPS, www.carnivorousplants.org/cp/evolution/DroseraPhylogeny.
7. Verbeek, N. A. M., and R. Boasson. “Relationship between Types of Prey Captured and Growth Form in Drosera in Southwestern Australia.” Austral Ecology, vol. 18, no. 2, 1993, pp. 203–207., doi:10.1111/j.1442-9993.1993.tb00444.x.
8. Lichtner, F. T., and S. E. Williams. “Prey Capture And Factors Controlling Trap Narrowing In Dionaea (Droseraceae).” American Journal of Botany, vol. 64, no. 7, 1977, pp. 881–886., doi:10.1002/j.1537-2197.1977.tb11931.x.
9. Baleeiro, Paulo C, et al. “Drosera Stipularis, a New Species for the D. Petiolaris Complex from Cape York Peninsula, Queensland.” Telopea, openjournals.library.sydney.edu.au/index.php/TEL/article/view/14200.
10. Tamura K, Dudley J, Nei M & Kumar S (2007) MEGA4: Molecular Evolutionary Genetics Analysis (MEGA) software version 4.0. Molecular Biology and Evolution 24:1596-1599. (Publication PDF at http://www.kumarlab.net/publications)
11. “Maximum Parsimony Methods.” Encyclopedia of Entomology, pp. 1358–1358., doi:10.1007/0-306-48380-7_2546.
12. “The UPGMA Algorithm.” Computing for Biologists, pp. 163–174., doi:10.1017/cbo9781107337510.016.
13. “Drosera Caduca: Bourke, G.” IUCN Red List of Threatened Species, 2016, doi:10.2305/iucn.uk.2018-1.rlts.t66437523a143975366.en.
14. “Drosera Schizandra.” Carnivorous Plant Resource, 11 Apr. 2019, carnivorousplantresource.com/the-plants/drosera-schizandra/.
15. Tamura K, Dudley J, Nei M & Kumar S (2007) MEGA4: Molecular Evolutionary Genetics Analysis (MEGA) software version 4.0. Molecular Biology and Evolution 24:1596-1599. (Publication PDF at http://www.kumarlab.net/publications)
16. Erickson, Keith. “The Jukes-Cantor Model of Molecular Evolution.” Primus, vol. 20, no. 5, 2010, pp. 438–445., doi:10.1080/10511970903487705.
17. Schneider, C. A.; Rasband, W. S. & Eliceiri, K. W. (2012), "NIH Image to ImageJ: 25 years of image analysis", Nature methods 9(7): 671-675, PMID 22930834 (on Google Scholar).
18. GBIF.org (27 June 2020) GBIF Occurrence Download https://doi.org/10.15468/dl.mkvzrt
19. “Use of Bureau of Meteorology Data by Other Providers.” Reuse of Bureau Data, reg.bom.gov.au/data-access/3rd-party-attribution.shtml.
20. "QGIS Development Team, 2009. QGIS Geographic Information System. Open Source Geospatial Foundation." Qgis, http://qgis.org
21. Steven J. Phillips, Miroslav Dudík, Robert E. Schapire. [Internet] "Maxent software for modeling species niches and distributions (Version 3.4.1)", http://biodiversityinformatics.amnh.org ... ce/maxent/. Accessed on 2020-7-28.
22. Oksanen, Jari, and F. Guillame Blanchet. “Vegandevs/Vegan.” GitHub, 2019, github.com/vegandevs/vegan.
Figure 1: The Bryastrum/Petiolaris clade, created with MEGA-X software, using the Jukes-cantor method and bootstrapping as a test of phylogeny. A delta symbol designates a species used in the study.
Figure 2: MaxEnt models are shown, using Australian Bureau of Meteorology raster data and GBIF occurrences of each species. Warmer colors indicate a stronger probability of finding the species in situ, and cooler colors indicate a weaker probability of finding the species. White dots show actual occurrences of the species.
Figure 3: The NMDS plot shows clusters of each species.
Figure 4: Left to right: D. petiolaris, D. stipularis, and D. paleacea. D. petiolaris and D. stipularis share prominent stipules that cover the growth point, while D. petiolaris and D. stipularis both share cupped traps. D. paleacea and D. stipularis share compact growth habit.
Figure 5: Species used for the experiment. All species were compared with a centimeter tape. Clockwise from top left: D. falconeri, D. petiolaris, D. caduca, D. ordensis, D. leucoblasta, D. paleacea. Note the presence of a very prominent stipule in D. leucoblasta; D. falconeri is entering dormancy at the time of the photos.
Figure 6: During Winter, the apical meristem of the sundews in Sect. Bryastrum forms gemmae, which are propelled from the plant when struck by raindrops.
Carnivorous plants are a diverse group of plants that are able to exploit different niche-spaces than typical plants due to their ability to capture small, typically arthropod prey. Drosera, the sundews, are widely distributed throughout Australia and found in a diverse group of habitats. We asked the question how environmental parameters and species range have affected morphological characteristics. By measuring morphological characteristics of six species and used climatological data, we were able to model niche-spaces and associate different morphologies with varying niche-spaces. It was found that several climatological parameters influenced the range of each species, and also determined the morphological characteristics of each species. We also noticed instances of putative niche-partitioning between sundews in Sects. Bryastrum and Lasiocephala. It was also found that humidity, rainfall, and temperature all had statistically significant effects on the morphologies of the species studied. Furthermore, our study reveals that the species in Sects. Bryastrum and Lasiocephala differ in response to different ecological parameters, with a more We also hypothesized different morphologies that complicate interspecific competition and niche-spaces, including gemmae, the loss of carnivory, and different growth habits. We conclude that it is likely that most Australian Drosera is affected by micro-and macro-climatological parameters.
Introduction:
Carnivorous plants are one of the most notable groups of plants due to their unique ability to digest other organisms, or in some cases substances, to obtain nutrients. They typically attract, catch, and digest prey by using modified structures called traps. Carnivory is observed in several orders, notably Droseraceae, Sarraceniaceae, and Lentibularaceae, which have been shown to have evolved independently to carnivory (1).
Carnivorous plants exist on every continent except Antarctica, and over 750 extant species of carnivorous plants have been described, indicating that carnivory is not an anomaly, rather, it is a successful strategy that increases a species’ fitness. Several species are also recognized as protocarnivorous, hinting that carnivorous habits lie on a spectrum, ranging from completely autotrophic, to majorly heterotrophic. Certain species in the genus Ibicella, for example, have been shown to be able to catch and immobilize prey, while no evidence of nutrient absorbance has been discovered (CITATION). Roridula is a genus shown to be able to digest nutrients through sticky tentacles on its leaves, but it requires symbiotic assassin-bugs (Rorida sp.) to digest its prey (citation). For the purposes of this paper, the phrase ‘carnivorous plants’ refers to a plant that is able to catch, immobilize, and digest prey without any external aid.
The evolution of carnivory has allowed carnivorous species to live in nutrient-poor soils because they are able to obtain crucial nutrients (N, P, and K) from prey or other organic matter (2). It has been suggested that carnivory is a cost-benefit model, in which plants attempt to balance between photosynthetic and heterotrophic functions. Recent studies have demonstrated that increased prey capture may result in more efficient photosynthesis in carnivorous plants (https://pubmed.ncbi.nlm.nih.gov/19454591/) and that energy investment on carnivory varies with the nutrients present in the soil (https://pubmed.ncbi.nlm.nih.gov/31402798/). It follows that, depending on where a species is spatially located, as well as according to the prey targeted, that each species will have different morphologies and strategies for trapping prey.
Carnivorous plants, thus, occupy different niches by specializing on different types of prey through various trap morphologies and attractants. For example, corkscrew traps found in Genislea allow it to easily capture microorganisms, while the ciliate pitchers of Heliamphora can catch larger insects (3). Unique trapping structures allow different carnivorous plants to capitalize on different sources of energy, causing less competition. In certain genera, morphologies are quite varied, for instance, in the genus of pitcher-plants, Nepenthes. Nepenthes lowii is a primarily coprophagic plant, Nepenthes inermis acts as a sticky trap instead of a pitfall trap, and Nepenthes ampullaria obtains a large amount of its nutrients from decaying plant matter that falls into its pitchers. This demonstrates that drastically different adaptations exist to allow carnivorous plants to obtain nutrients from prey or other organic matter.
Drosera, commonly known as sundews, are known to possess glanduliferous tentacles on their leaves to capture, immobilize, and digest prey (2). This genus presents many different trap morphologies, including several different types of tentacles (2). It has been hypothesized that the genus Drosera originated in Australia; now Drosera are found on every major landmass except Antarctica (Citation needed). Further complicating the phylogeny of Drosera, putative cases of long-distance dispersal have been hypothesized, for example in the Venezuelan species Drosera meristocaulis (Cite the Meristo paper). Over fifty species of Drosera are found in Australia, spread in several Sections (Sects). Since Drosera likely originate from Australia, and Australia’s wide range of ecosystems and microhabitats present a unique opportunity for diversification and niche-partitioning, we decided to study Australian sundews for this study.
The genus Drosera contains several sections, including Sects. Bryastrum and Lasiocephala, which both share a common ancestor, and are both endemic to Australia (6).. Many of the species described in both Sect. Bryastrum and Sect. Lasiocephala are under-documented, and very few instances in GBIF (Global Biodiversity Information Facility) have been recorded of D. caduca and D. falconeri (n=12 and n=30, respectively).
The species in Sect. Lasiocephala, originating from tropical grasslands in the north of Australia, are known to be able to inter-hybridize, producing fertile hybrids, a phenomenon not commonly seen (Citation needed). It is thus possible that several species in this clade are of hybrid origin. Certain species in sect. Lasiocephala are also known to have weak species-defining characteristics, further complicating the genetic history of the clade. Furthermore, the species in sect. Lasiocephala all have similar growth habits, including semi-erect rosettes and subpeltate trap insertions except for D. falconeri, which is known for its large, flat traps, and prostrate growth habit (Lowrie CITATION NEEDED RICE). Such overlap in morphology and growth habits presents a unique opportunity to study subtle morphological variations, and to correlate them with ecological parameters, in order to postulate a relationship between the two.
The members of Sect. Bryastrum, however, occur in the south of Australia, in a Mediterranean chaparral biome. Commonly known as ‘pygmy sundews’ due to their diminutive size, often smaller than 2cm across, this clade possesses several characteristics that set it apart from other Drosera. The species are known to readily propagate asexually by gemmae, and are less fecund than other species of Drosera. They also possess long, thin, red roots, which penetrate the soil deeply and anchor the plant to the ground quite firmly. Furthermore, when compared to the stipules in Sect. Lasiocephala, the stipules found in Sect. Bryastrum’s species are quite prominent. Despite these distinctive characteristics, preliminary genomic analysis using MEGA-X software suggests that Sect. Lasiocephala is a daughter of Sect. Bryastrum.
Six species were chosen for the experiment, from Sect. Bryastrum (B) and Sect. Lasiocephala (L). The species used were Drosera paleacea (B), Drosera leucoblasta (B), Drosera caduca (L), Drosera falconeri (L), Drosera ordensis (L), and Drosera petiolaris (L).
We investigated the correlations between environmental parameters and plant morphologies, to test if there were any significant climatological factors influencing plant morphologies and species range in Sects. Bryastrum and Lasiocephala, which could have implications for speciation in both sections. We hypothesized that rain, humidity, solar radiation, UV index, and sunlight intensity would significantly affect the species distribution patterns and morphological characteristics of each species.
Results:
Code: Select all
Data from personal specimens of the plants was randomly selected, and the characteristics were measured, and compared to climate data in order to determine species response to the varying climatological conditions. Data for each species were statistically different from all other species (MANOVA, p<0.001). Each species’ morphological characteristics, once measured, were averaged for rough comparisons (Table 1).+---------------------------------------------------+--+-----------------------------------------------------------------------------+-------------------------------------------------------------------------------------------+--+--+--+--------------------+--+--+--+--------------+--+--+--+----------------------+--+---+---+---+
| | | | | | | | | | | | | | | | | | | | |
| Table 1: Average Morphological Characteristics | | | | | | | | | | | | | | | | | | | |
+---------------------------------------------------+--+-----------------------------------------------------------------------------+-------------------------------------------------------------------------------------------+--+--+--+--------------------+--+--+--+--------------+--+--+--+----------------------+--+---+---+---+
| | | | | | | | | | | | | | | | | | | | |
| Species name: | | | Tentacle Density¹ | | | | Tentacle Length | | | | Trap Area | | | | Trichome Density¹ | | | | |
+---------------------------------------------------+--+-----------------------------------------------------------------------------+-------------------------------------------------------------------------------------------+--+--+--+--------------------+--+--+--+--------------+--+--+--+----------------------+--+---+---+---+
| | | | | | | | | | | | | | | | | | | | |
| D. caduca | | | 65 | | | | 0.21 | | | | 0.35 | | | | 0 | | | | |
+---------------------------------------------------+--+-----------------------------------------------------------------------------+-------------------------------------------------------------------------------------------+--+--+--+--------------------+--+--+--+--------------+--+--+--+----------------------+--+---+---+---+
| | | | | | | | | | | | | | | | | | | | |
| D. falconeri | | | 756 | | | | 0.03 | | | | 10.22 | | | | 35 | | | | |
+---------------------------------------------------+--+-----------------------------------------------------------------------------+-------------------------------------------------------------------------------------------+--+--+--+--------------------+--+--+--+--------------+--+--+--+----------------------+--+---+---+---+
| | | | | | | | | | | | | | | | | | | | |
| D. leucoblasta | | | 4074 | | | | 0.07 | | | | 0.05 | | | | 696 | | | | |
+---------------------------------------------------+--+-----------------------------------------------------------------------------+-------------------------------------------------------------------------------------------+--+--+--+--------------------+--+--+--+--------------+--+--+--+----------------------+--+---+---+---+
| | | | | | | | | | | | | | | | | | | | |
| D. ordensis | | | 151 | | | | 0.22 | | | | 0.54 | | | | 3,435 | | | | |
+---------------------------------------------------+--+-----------------------------------------------------------------------------+-------------------------------------------------------------------------------------------+--+--+--+--------------------+--+--+--+--------------+--+--+--+----------------------+--+---+---+---+
| | | | | | | | | | | | | | | | | | | | |
| D. paleacea | | | 1269 | | | | 0.14 | | | | 0.14 | | | | 57 | | | | |
+---------------------------------------------------+--+-----------------------------------------------------------------------------+-------------------------------------------------------------------------------------------+--+--+--+--------------------+--+--+--+--------------+--+--+--+----------------------+--+---+---+---+
| | | | | | | | | | | | | | | | | | | | |
| D. petiolaris | | | 554 | | | | 0.18 | | | | 0.38 | | | | 167 | | | | |
+---------------------------------------------------+--+-----------------------------------------------------------------------------+-------------------------------------------------------------------------------------------+--+--+--+--------------------+--+--+--+--------------+--+--+--+----------------------+--+---+---+---+
| | | | | | | | | | | | | | | | | | | | |
| | | Table 1: The average morphologies studied for each species are listed. | | | | | | | | | | | | | | | | | |
+---------------------------------------------------+--+-----------------------------------------------------------------------------+-------------------------------------------------------------------------------------------+--+--+--+--------------------+--+--+--+--------------+--+--+--+----------------------+--+---+---+---+
| | | | | | | | | | | | | | | | | | | | |
| | | ¹ | Tentacle Density and Trichome Density were measured in number per square centimeter. | | | | | | | | | | | | | | | | |
+---------------------------------------------------+--+-----------------------------------------------------------------------------+-------------------------------------------------------------------------------------------+--+--+--+--------------------+--+--+--+--------------+--+--+--+----------------------+--+---+---+---+
| | | | | | | | | | | | | | | | | | | | |
| | | ² | Lamina width was measured at the widest part of the leaf. | | | | | | | | | | | | | | | | |
+---------------------------------------------------+--+-----------------------------------------------------------------------------+-------------------------------------------------------------------------------------------+--+--+--+--------------------+--+--+--+--------------+--+--+--+----------------------+--+---+---+---+Multiple Linear regressions were carried out in R and reported, along with the adjusted multiple r2 values (Table 2). Relative humidity was the most significant predictor for each morphology, (t-test, p<0.001 for all samples), followed by average rainfall (t-test, p<0.05 for all samples).
Code: Select all
Maximum entropy modelling prediction weights were also reported (Table 3). The MaxEnt weights differ from the Linear Regression weights in that they predict the species geographical range based upon existing observations. Interestingly, the results differed between Sect. Bryastrum and Sect. Lasiocephala, as the model for Lasiocephala used primarily rain and frost data, while the Sect. Bryastrum model used each factor almost equally. Statistical analysis revealed different variable importance between species (MANOVA, p<0.001).+---------------------+-------------------------------------------------------------------------------------------------------------+--------------+
| | | |
| | Table 2: Multiple Linear Regression Equations | |
+---------------------+-------------------------------------------------------------------------------------------------------------+--------------+
| | | |
+---------------------+-------------------------------------------------------------------------------------------------------------+--------------+
| | | |
| Morphology | Regression Equation | r² |
+---------------------+-------------------------------------------------------------------------------------------------------------+--------------+
| | | |
| Tentacle Density | Y = 29.5(9am Relative Humidity) - 122.44(Average Temperature) + 2385.25 | 0.4951 * |
+---------------------+-------------------------------------------------------------------------------------------------------------+--------------+
| | | |
| Trap Area | Y = 0.1928(9am Relative Humidity) + 0.561(Average Temperature) + 0.0035(Evapotranspiration) - 28.347 | 0.7242 ** |
+---------------------+-------------------------------------------------------------------------------------------------------------+--------------+
| | | |
| Tentacle Length | Y = -0.0049(9am Relative Humidity) - 0.0039(Average Temperature) + 0.556 | 0.3356 * |
+---------------------+-------------------------------------------------------------------------------------------------------------+--------------+
| | | |
| Lamina Width | Y = 0.01395(Average Temperature) + 0.00018(Average Rainfall) - 0.3631 | 0.8242 ** |
+---------------------+-------------------------------------------------------------------------------------------------------------+--------------+
| | | |
| Trichome Density | Y = 89.255(9am Relative Humidity) + 176.011(Average Temperature) - 3.171(Average Rainfall) - 7097.59 | 0.4021 * |
+---------------------+-------------------------------------------------------------------------------------------------------------+--------------+
| | | |
+---------------------+-------------------------------------------------------------------------------------------------------------+--------------+
| | | |
| | Table 2: Linear Regression equations are listed. All predictors significant at p<0.05. | |
+---------------------+-------------------------------------------------------------------------------------------------------------+--------------+
| | | |
| | * r² is significant at p<0.05 | |
+---------------------+-------------------------------------------------------------------------------------------------------------+--------------+
| | | |
| | ** r² is significant at p<0.01 | |
+---------------------+-------------------------------------------------------------------------------------------------------------+--------------+Code: Select all
+-------------------+--+--+-----------------------------------------------------------------------------------------------------------------------+--------+--------+---------+
|                   |  |  |                                                                                                                       |        |        |         |
|                   |  |  | Table 3: Variable Importance to Species Models                                                                        |        |        |         |
+-------------------+--+--+-----------+----+--+--+----------+---+--+--+----------+-----+-----+-----+---------+-------+------+-----+--------+------+--+-----+--+-----+--+------+
|                   |  |  |           |    |  |  |          |   |  |  |          |     |     |     |         |       |      |     |        |         |        |        |      |
+-------------------+--+--+-----------+----+--+--+----------+---+--+--+----------+-----+-----+-----+---------+-------+---+--+--+--+--+-----+---------+--+-----+--+-----+--+---+
|                   |  |  |                |  |  |              |  |  |                |     |     |                     |     |     |                  |        |        |   |
| Species:          |  |  | 9a Humidity    |  |  | Rainfall     |  |  | Frost Days¹    |     |     | Solar Radiation²    |     |     | Temperature      |        |        |   |
+-------------------+--+--+-----------+----+--+--+----------+---+--+--+----------+-----+-----+-----+---------+-----------+-----+-----+---------+--------+--------+--------+---+
|                   |  |  |           |       |  |          |      |  |          |           |     |         |                 |     |         |                 |        |   |
| D. caduca         |  |  | 6.1       | %     |  | 57.9     | %    |  | 28.5     | %         |     | 3.0     | %               |     | 4.4     | %               |        |   |
+-------------------+--+--+-----------+-------+--+----------+------+--+----------+-----------+-----+---------+-----------------+-----+---------+-----------------+--------+---+
|                   |  |  |           |       |  |          |      |  |          |           |     |         |                 |     |         |                 |        |   |
| D. falconeri      |  |  | 10.6      | %     |  | 58.2     | %    |  | 22.6     | %         |     | 2.5     | %               |     | 6.1     | %               |        |   |
+-------------------+--+--+-----------+-------+--+----------+------+--+----------+-----------+-----+---------+-----------------+-----+---------+-----------------+--------+---+
|                   |  |  |           |       |  |          |      |  |          |           |     |         |                 |     |         |                 |        |   |
| D. ordensis       |  |  | 6.1       | %     |  | 57.9     | %    |  | 28.5     | %         |     | 3.0     | %               |     | 4.4     | %               |        |   |
+-------------------+--+--+-----------+-------+--+----------+------+--+----------+-----------+-----+---------+-----------------+-----+---------+-----------------+--------+---+
|                   |  |  |           |       |  |          |      |  |          |           |     |         |                 |     |         |                 |        |   |
| D. petiolaris     |  |  | 5.0       | %     |  | 39.8     | %    |  | 50.0     | %         |     | 0.6     | %               |     | 4.6     | %               |        |   |
+-------------------+--+--+-----------+-------+--+----------+------+--+----------+-----------+-----+---------+-----------------+-----+---------+-----------------+--------+---+
|                   |  |  |           |       |  |          |      |  |          |           |     |         |                 |     |         |                 |        |   |
| D. leucoblasta    |  |  | 16.8      | %     |  | 19.1     | %    |  | 18.2     | %         |     | 21.4    | %               |     | 24.5    | %               |        |   |
+-------------------+--+--+-----------+-------+--+----------+------+--+----------+-----------+-----+---------+-----------------+-----+---------+-----------------+--------+---+
|                   |  |  |           |       |  |          |      |  |          |           |     |         |                 |     |         |                 |        |   |
| D. paleacea       |  |  | 3.7       | %     |  | 15.6     | %    |  | 29.4     | %         |     | 36.4    | %               |     | 15.0    | %               |        |   |
+-------------------+--+--+-----------+----+--+--+----------+---+--+--+----------+-----+-----+-----+---------+-------+------+--+--+--+-----+---+-----+--------+--+-----+--+---+
|                   |  |  |           |    |  |  |          |   |  |  |          |     |     |     |         |       |      |     |        |         |        |        |      |
+-------------------+--+--+-----------+----+--+--+----------+---+--+--+----------+-----+-----+-----+---------+-------+------+-----+--------+---------+-----+--+-----+--+------+
|                   |  |  |                                                                                                                                |        |         |
|                   |  |  | Table 3: MaxEnt variable importance weights   are listed for each species as a percent.                                        |        |         |
+-------------------+--+--+--------------------------------------------------------------------------------------------------------------------------------+--------+---------+
|                   |  |  |                                                                                                                                                   |
|                   |  |  | ¹ Frost Days are defined as the number of days   per year where the low temperature is below 0°C                                                  |
+-------------------+--+--+---------------------------------------------------------+-----+-----+-------+--------+-------+-----+-----+---------+--------+--------+--------+---+
|                   |  |  |                                                         |     |     |       |        |       |     |     |         |        |        |        |   |
|                   |  |  | ² Solar Radiation is measured in GJ/m²/year.            |     |     |       |        |       |     |     |         |        |        |        |   |
+-------------------+--+--+-----------+----+--+--+----------+---+--+--+----------+--+--+--+--+--+--+----+----+---+---+---+--+--+--+--+-----+---+--+--+--+--+--+--+--+--+--+---+
|                   |  |  |           |    |  |  |          |   |  |  |          |  |  |  |  |  |  |    |    |   |   |   |  |  |  |  |     |   |  |  |  |  |  |  |  |  |  |   |
+-------------------+--+--+-----------+----+--+--+----------+---+--+--+----------+--+--+--+--+--+--+----+----+---+---+---+--+--+--+--+-----+---+--+--+--+--+--+--+--+--+--+---+
Lastly, a NMDS (Non-Metric Multidimensional Scaling) plot was created based off the morphological characteristics of each species (Figure 3). The NMDS plot reveals that the morphological characteristics of D. paleacea, D. falconeri, D. caduca, and D. petiolaris are more similar, while D. leucoblasta and D. ordensis are more distant (Figure 3).
Discussion:
Our study aimed to identify factors associated with divergence within the monophyletic clade formed by Sect. Bryastrum and Lasiocephala. To accomplish this aim, ‘type’ specimens of each species were measured for selected morphological characteristics; publicly available climatic data was then used to carry out niche modeling with distributional data taken from GBIF. We initially hypothesized that each of the selected climate conditions played a role in shaping morphological characteristics and therefore, speciation; this hypothesis was only partially supported by the data. We reported a statistically significant MANOVA score of the morphological characteristics, and each species exhibited clear distribution patterns, as modelled by MaxEnt software.
Environmental conditions affecting morphology:
Humidity appears to play a role in determining morphological characteristics, and it was the third-most important factor besides precipitation and frost days for determining range (Table 2, Table 3). The regression equation for tentacle density included humidity, and was statistically significant, (r2 = 0.495, p<0.01). Since Drosera employ glandular tentacles to capture and attract prey, and the tentacles constantly exude a sweet and sticky substance to attract and capture prey, it is likely difficult to maintain high densities of tentacles in arid areas. While a plant may possibly produce less tentacles to avert losing water, it must also provide itself with enough nutrients to offset the energy costs of the tentacles. Higher humidities could allow a plant to make more tentacles per given area, as the plant could lose less water due to lower rates of evapotranspiration. Conversely, plants in more arid environments may be more likely to have less tentacles and less dew, because the lack of humidity may not allow the plant to obtain enough water to support dew production. This hypothesis is supported by our linear regression models, which predict that for every percent of humidity, the number of tentacles per square centimeter increases by 29.5 (Table 2).
D. ordensis was removed from the other sundews on the NMDS plot of morphological characters (Figure 3). This placement is likely driven by the large number of trichomes on the lamina, on average 3435 per square centimeter of leaf (Table 1). The trichomes likely prevent water loss through evapotranspiration, and potentially allow the plants to use water from fog and dew. D. ordensis’ estimated species range overlaps with D. petiolaris, and they both possess a similar trap structure, so they are likely to capture the same prey (Figure 2, Figure 5). Interestingly, while the species range of both species overlaps, MaxEnt models show D. ordensis hotspots where D. petiolaris probabilities are low, and significant D. petiolaris hotspots where D. ordensis probabilities are low. It may be that the evolution of dense trichomes in D. ordensis allowed this species to capitalize on different microhabitats, likely in warmer areas, avoiding competition with D. petiolaris for the same prey sources. It is thus likely that competition for prey sources is common in areas with many species of sundew, so other Sects. of sundews also likely have evolved different mechanisms to live in areas inhospitable for the competing species.
A recently discovered species, Drosera stipularis, is characteristic of both sundews in Sects. Bryastrum and Lasiocephala (9) (Figure 4). The species forms a prominent stipule cover over the main bud, and measures approximately two centimeters across (9). It inhabits exposed sand-pockets on dunes, more similar to the sundews in Sect. Bryastrum, whereas the sundews in Sect. Lasiocephala enjoy moist to inundated soil in sedges and woodlands (9). D. stipularis most likely D. stipularis may demonstrate that smaller sundews prefer more light, and evolve long, prominent stipules to prevent desiccation in such exposed environments. Drosera meristocaulis, a sundew reminiscent of those in Sect. Bryastrum, was hypothesized by researchers to be in a clade sister to the species in Sect. Bryastrum. D. meristocaulis, being located in drier regions of the Neblina massif, faces similar conditions to the species in Sect. Bryastrum. The researchers claim that this likely enforced the characteristics of D. meristocaulis to keep its reminiscent characteristics while having been separated from the Australian sundews for a relatively long time. These findings are likely applicable to D. stipularis, whereby a dry, changing climate enforces Bryastrum-like morphological characteristics.
For both sundews tested in Sect. Bryastrum, solar radiation was relatively important to the MaxEnt model (Table 3). The sundews from this section are spatially located in the South of Australia, where water is scarcer, and the sun is and the sun is very direct during spring and early summer, during their season of active growth. Because most species in Sect. Bryastrum do not exceed 1 centimeter across, there is little photosynthetic area on the plant. High amounts of solar radiation may be needed to allow enough photosynthesis for growth of the traps and production of dew, given the small size of the plants. Conversely, too much photosynthetic area on the plant would likely increase the amount of water needed to sustain growth and turgor pressure. Similarly to D. stipularis, many species in Sect. Bryastrum exhibit a stipule bud, likely to prevent desiccation during the late-summer dormancy characteristic of several species when the solar radiation is at its peak. It is also likely that the stipules shield the site of active cell differentiation from the sun, blocking most of the harmful UV rays that might enter the dividing tissue at the meristem.
Unique morphologies allowing occupation of unique niches :
D. falconeri’s predicted range is found overlapping with a hotspot in D. petiolaris’ putative distribution (Figure 2). D. falconeri has a drastically different growth habit and structure from D. petiolaris, with very dense, short tentacles on large traps, while D. petiolaris is more erect and has small, cupped traps with long tentacles (Table 1). Erect sundews have been shown to more likely catch aerial prey, and prostrate rosettes have been shown to more likely catch ground-dwelling prey (7). It is likely that the large, planar leaves of D. falconeri likely touch the soil surface, and this hypothesis is further bolstered by the presence of a large number of trichomes on the adaxial surface of the leaves and traps. A planar trap at the surface of the soil seems most advantageous for larger walking prey and the especially dense carpet of tentacles would allow the plant to come in contact with a large area of its prey, allowing for easier entrapment and more tentacles to digest the nutrients. D. petiolaris’ traps, contrarily, are small, with long tentacles, and are held in the air. These traps are unlikely to catch any ground-dwelling prey, and the cupped shape may allow more efficient capture of flying prey, discussed later. Thus, it is very reasonable that the differences in trap-shape allow both species to coexist with limited interspecific competition, due to the capture of different types of prey.
D. caduca is named for its characteristic loss of traps in the adult phase, a phenomenon only seen in this single species (13). It only forms traps during the seedling phase, or directly after the plant emerges from dormancy. The species also possesses contractile roots, not seen in any other in Sect. Lasiocephala. The loss of traps and storage organ (contractile roots) allude that the sundew likely stores nutrients from captured prey, and does not need to replenish the supply of stored nutrients very often, only following periods of new growth post-dormancy. It is thus plausible to conclude that this species is evolving away from carnivory, however there are many possible reasons for this phenomenon. One hypothesis is that D. caduca’s loss of tentacles and carnivorous habit is due to interspecific competition with D. petiolaris, which exhibits many similar morphological characteristics, including tentacle length and trap size (table 1). An interesting observation to note was that while D. petiolaris had a tentacle density of 554, D. caduca had a tentacle density of just 65 (Table 1). It could be that traps with more tentacle density are more efficient in trapping prey, and the difference in tentacle density caused D. caduca to lose its traps. It could also likely be that as a result of competition, D. caduca was not able to offset the energy costs of maintaining a high tentacle density, and through interspecific competition, gradually evolved less tentacle density, until reaching the ‘equilibrium point’ where the expected gains from prey capture are greater than the expected energy loss from producing “dew” on the traps.
Furthermore, the erect species D. caduca, D. ordensis, and D. petiolaris all possess very long tentacles, likely to trap prey flying by the trap (Table 1, CITATION https://www.ncbi.nlm.nih.gov/pmc/articles/PMC3907454/). D. falconeri, conversely, has very short tentacles, probably to allow walking insects to easily be trapped, and gluing them close to the leaf, where they are not likely to escape, as discussed above. Species with different tentacle lengths can likely overlap in range as they occupy different predatory niches. Interestingly, this is seen only in two examples of the species studied – D. petiolaris and D. falconeri, and D. paleacea and D. leucoblasta (Figure 2, Table 1). An example of this working inversely, D. caduca and D. ordensis’ distributions overlapped, with tentacle sizes roughly identical, and D. caduca loses its traps once it matures, as it is likely moving away from carnivory. It is thus very plausible that tentacle length is a major point of differentiation for the sundews in both sections studied. The tentacle length was demonstrated to have a weak, linear correlation with trap size, implying that trap morphologies other than tentacles were also important to speciation in Drosera.
It has also been demonstrated that plants with cupped traps in Sect. Lasiocephala push insects glued to tentacles onto the medial surface of the trap, using their long, aerial-prey-optimized tentacles, potentially enabling the plant to catch stronger prey that can potentially escape from the trap. The Venus Flytrap (Dionaea muscipula) possesses a unique bear-claw trap that closes around prey to secure prey and ensure proper digestion, comparable to cupped traps (8). Similar to the D. muscipula, the curved surface of the trap may allow more surface area for digestion, and provide a secure containment for captured prey. Thus, the species with cupped traps may be able to catch stronger and larger prey due to their unique trap shapes, potentially allowing them catch different types of prey and avoid competition with other species. A cupped trap allows for more surface contact with the prey, allowing more of the insect to be digested, allowing the plant to leach more nutrients from its prey. Furthermore, other species of Drosera exhibit a thigmotropic response, utilizing the entire leaf to fold and curl around prey items (CITATION). A cupped trap eliminates the need for such a dramatic response, instead using tentacles to push the prey into the trap. Thus, is likely that a cupped trap benefits these plants from an energy-optimization perspective, but at the moment, there is no existing research to prove any of these hypotheses. Studies of the enzymes produced by these plants might allow us to determine how morphologies such as cupped traps arose, discussed later.
The species of Sect. Bryastrum all produce gemmae, small bundles of undifferentiated cells, that are able to clonally propagate once dispersed by raindrops or wind (CITATION). At the advent of winter, once temperatures begin to cool, the gemmae begin forming at the apical meristem of the plant, and new growth halts temporarily (Figure 6 NEW FIGURE ). The gemmae eventually tightly pack together, causing high pressures, and are dispersed once disturbed by a raindrop, scattering in the surrounding soil. The presence of gemmae is unique to Sect. Bryastrum, and species producing gemmae allocate a large proportion of N and P towards producing gemmae (https://www.publish.csiro.au/BT/BT9920353). This indicates that gemmae are a highly successful strategy for asexual propagation in Sect. Bryastrum. Furthermore, the production of gemmae means that more successful clones of a single species could out-compete other clones of the same species, possibly causing less species variation. With the ability to create greater than 30 gemmae per plant, interspecific competition may be further complicated by successful clones dominating inferior plants in situ. Perhaps, due to the high amount of energy required to produce gemmae, more successful predatory plants are able to obtain more energy and thus produce more gemmae, selecting for the plants which catch prey more effectively. Such competition could cause species to be hyper-adapted to their environments and the specific species they aim to catch, allowing each species to potentially exploit its own micro-niche.
Limitations and further implications.
This study’s morphological evidence was limited in that only one plant of each species from Sect. Lasiocephala was used, as we did not have access to a large number of these plants. The specimens used were also ‘type’ specimens, meaning that we could not capture regional diversity in morphologies found within wild variants of the species. In future studies, it would be advantageous to use several plants from different locations, in order to capture variations in morphology. Another factor is that most of the plants in cultivation are generally more vigorous forms that are able to tolerate horticulture. Thus, in using horticultural specimen plants, we likely inadvertently studied some of the hardiest plants from each species. This could be averted in future studies by using plants randomly selected from the wild.
For the species in Sect. Bryastrum, a significant area in the southeast of Australia and on Tasmania was predicted as highly likely species range by MaxEnt modelling. Unlike D. caduca, we had several instances of data for both of the species studied. This likely implies that there are other ecological parameters beyond the scope of this study that have an influence on Drosera species distribution. Further studies would help elucidate what parameters these are.
The MaxEnt results discussed may be an appropriate starting point for further field studies to determine the true range of each species. D. caduca only had 12 coordinate occurrences in GBIF, limiting this study. Further field studies may help us build our knowledge about species’ in situ interactions with insects and arachnids, as well as helping us pinpoint the actual ranges of each species studied. Analyzing the enzymes in the mucilage on the tentacles may also allow us to learn more about what each species is capable of digesting, and might shed new light on the factors driving speciation. These results could likely also have implications for determining morphologies that aid in insect capture – if certain enzymes are found with certain trap morphologies, it could be conjectured that a certain trap is optimized for a certain prey.
Lastly, one of the species studied, Drosera caduca, presents to biologists a rare phenomenon – a plant moving away from carnivory. Many species are considered ‘protocarnivorous’ and thought to be moving towards carnivory, such as Stylidium sp., Roridula sp., and Ibicella sp. Understanding how and why D. caduca is moving away from carnivory may also allow us insight into how carnivorous plants evolve the morphologies and enzymes needed for capture and digestion of prey. By analyzing the factors causing D. caduca to leave carnivory, further studies could provide clues to the factors encouraging plants to develop unique mechanisms to capture insects and other prey.
Conclusion:
In conclusion, certain environmental characteristics, including relative humidity, temperature, and rainfall, are significantly associated with morphological characteristics of species in Sects. Lasiocephala and Bryastrum. Through allowing species to inhabit different predatory niches and establish in new environments, morphological adaptations may have encouraged divergence with this clade. Similarly, morphological characteristics have allowed species to occupy different predatory niches, to avoid competition. In some cases, however, competition results in a loss of species diversity or evolution away from carnivory. The effects of environmental parameters, as demonstrated by our work, can likely be applied to all Australian species of Drosera, allowing us to better understand how and why carnivorous plants evolved.
Materials and Methods:
MEGA-X software was used to visualize the clade of Drosera and choose which species to use for the experiment (15). RbcL (plant plastid) sequences of many Drosera were downloaded from the NCBI NucCore, all of which had introns and stop codons removed. MEGA-X was used to align the sequencing data prior to constructing a phylogenetic tree. To build the phylogenetic tree, we utilized the Jukes-Cantor model, and one-hundred repetitions of bootstrapping was used to confirm the phylogenetic tree (16). The MEGA- X tree was used to select species to use for the study.
Based upon our results, we chose the six species from Sect. Bryastrum (B) and Sect. Lasiocephala (L). The species Drosera paleacea (B), Drosera leucoblasta (B), Drosera caduca (L), Drosera falconeri (L), Drosera ordensis (L), and Drosera petiolaris (L) were used for this study.
Specimens of D. paleacea, D. leucoblasta, D. caduca, D. falconeri, D. ordensis, and D. petiolaris were grown in a polycarbonate tank, under a 12 hour photoperiod beneath a 4000k CFL lighting system emitting 10,000 lux, in a 2:2:1:1 soil mix of Canadian peat moss, course horticultural perlite, #12 mesh silica sand, and milled Chilean long-fibered sphagnum moss. Humidity was maintained at 100% RH, and temperature was maintained at a constant 24 degrees Celsius. The plants were all grown in 3-inch pots, and were kept sitting in 1cm of water at all times. Prior to this experiment, the plants grew for three months in the grow-chamber in order to remove any non-genetic plant morphologies that were caused by microclimate.
The plants were photographed with a DSLR (Nikon) next to a standard millimeter ruler, to provide a scale for image processing software. Using ImageJ software, the trap area was measured with a polygon tool, on ten randomly selected traps on the plant (17). On another set of ten randomly selected traps, a square measuring 0.5mm x 0.5mm was randomly placed onto a random area of the trap. The square was saturated by 0.9%, and all of the tentacles on the trap were counted. To measure trichomes, the same procedure was repeated on the laminae of plants, on the adaxial side. Lamina width was measured by randomly selecting 10 leaves and measuring the width of the lamina at its widest point. Lastly, tentacle length was measured by randomly selecting another 10 leaves, and counting 10 randomly-selected tentacles on each leaf. The averages of each leaf’s tentacle length were recorded.
Location data was determined using GBIF (18). Raster files were downloaded from the Australian Bureau of Meteorology, for 9am relative humidity (%), actual evapotranspiration (mm/year), average temperature year-round (*C), average rainfall (mm), potential frost days (days), average solar radiation (GJ/M^2/year), and UV index (Index). The raster files were processed in Qgis (19), and data was selected at each location point specified by GBIF.
MaxEnt niche modelling software was used to determine potential spatial locations for all of the species (20). Using Qgis, the raster files were aligned, and the data was put into MaxEnt. The outputs of MaxEnt were used to quantify the response of the species range to different variables, and to determine potential locations of the species. Using R, multiple regression analyses of the morphological characteristics and temperature was also carried out, to determine a species’ morphological response to the different meteorological parameters we used. NMDS modelling was done using Package Vegan (21).
References:
1. Fukushima, Kenji, et al. “Genome of the Pitcher Plant Cephalotus Reveals Genetic Changes Associated with Carnivory.” Nature Ecology & Evolution, vol. 1, no. 3, 2017, doi:10.1038/s41559-016-0059.
2. Plant Biology Greenhouse, University of Illinois,
www.life.illinois.edu/plantbio/greenhou ... orous.html.
3. Ellison, Aaron M., and Nicholas J. Gotelli. “Energetics and the Evolution of Carnivorous Plants—Darwin's ‘Most Wonderful Plants in the World.’” Journal of Experimental Botany, vol. 60, no. 1, 2009, pp. 19–42., doi:10.1093/jxb/ern179.
4. Adamec, Lubomír. “Functional Characteristics of Traps of Aquatic Carnivorous Utricularia Species.” Aquatic Botany, vol. 95, no. 3, 2011, pp. 226–233., doi:10.1016/j.aquabot.2011.07.001.
5. Jordan, Sean M. R., et al. “Quantifying the Effects of the Break up of Pangaea on Global Terrestrial Diversification with Neutral Theory.” Philosophical Transactions of the Royal Society B: Biological Sciences, vol. 371, no. 1691, 2016, p. 20150221., doi:10.1098/rstb.2015.0221.
6. “Drosera Phylogeny.” Drosera Phylogeny | ICPS, www.carnivorousplants.org/cp/evolution/DroseraPhylogeny.
7. Verbeek, N. A. M., and R. Boasson. “Relationship between Types of Prey Captured and Growth Form in Drosera in Southwestern Australia.” Austral Ecology, vol. 18, no. 2, 1993, pp. 203–207., doi:10.1111/j.1442-9993.1993.tb00444.x.
8. Lichtner, F. T., and S. E. Williams. “Prey Capture And Factors Controlling Trap Narrowing In Dionaea (Droseraceae).” American Journal of Botany, vol. 64, no. 7, 1977, pp. 881–886., doi:10.1002/j.1537-2197.1977.tb11931.x.
9. Baleeiro, Paulo C, et al. “Drosera Stipularis, a New Species for the D. Petiolaris Complex from Cape York Peninsula, Queensland.” Telopea, openjournals.library.sydney.edu.au/index.php/TEL/article/view/14200.
10. Tamura K, Dudley J, Nei M & Kumar S (2007) MEGA4: Molecular Evolutionary Genetics Analysis (MEGA) software version 4.0. Molecular Biology and Evolution 24:1596-1599. (Publication PDF at http://www.kumarlab.net/publications)
11. “Maximum Parsimony Methods.” Encyclopedia of Entomology, pp. 1358–1358., doi:10.1007/0-306-48380-7_2546.
12. “The UPGMA Algorithm.” Computing for Biologists, pp. 163–174., doi:10.1017/cbo9781107337510.016.
13. “Drosera Caduca: Bourke, G.” IUCN Red List of Threatened Species, 2016, doi:10.2305/iucn.uk.2018-1.rlts.t66437523a143975366.en.
14. “Drosera Schizandra.” Carnivorous Plant Resource, 11 Apr. 2019, carnivorousplantresource.com/the-plants/drosera-schizandra/.
15. Tamura K, Dudley J, Nei M & Kumar S (2007) MEGA4: Molecular Evolutionary Genetics Analysis (MEGA) software version 4.0. Molecular Biology and Evolution 24:1596-1599. (Publication PDF at http://www.kumarlab.net/publications)
16. Erickson, Keith. “The Jukes-Cantor Model of Molecular Evolution.” Primus, vol. 20, no. 5, 2010, pp. 438–445., doi:10.1080/10511970903487705.
17. Schneider, C. A.; Rasband, W. S. & Eliceiri, K. W. (2012), "NIH Image to ImageJ: 25 years of image analysis", Nature methods 9(7): 671-675, PMID 22930834 (on Google Scholar).
18. GBIF.org (27 June 2020) GBIF Occurrence Download https://doi.org/10.15468/dl.mkvzrt
19. “Use of Bureau of Meteorology Data by Other Providers.” Reuse of Bureau Data, reg.bom.gov.au/data-access/3rd-party-attribution.shtml.
20. "QGIS Development Team, 2009. QGIS Geographic Information System. Open Source Geospatial Foundation." Qgis, http://qgis.org
21. Steven J. Phillips, Miroslav Dudík, Robert E. Schapire. [Internet] "Maxent software for modeling species niches and distributions (Version 3.4.1)", http://biodiversityinformatics.amnh.org ... ce/maxent/. Accessed on 2020-7-28.
22. Oksanen, Jari, and F. Guillame Blanchet. “Vegandevs/Vegan.” GitHub, 2019, github.com/vegandevs/vegan.
Figure 1: The Bryastrum/Petiolaris clade, created with MEGA-X software, using the Jukes-cantor method and bootstrapping as a test of phylogeny. A delta symbol designates a species used in the study.
Figure 2: MaxEnt models are shown, using Australian Bureau of Meteorology raster data and GBIF occurrences of each species. Warmer colors indicate a stronger probability of finding the species in situ, and cooler colors indicate a weaker probability of finding the species. White dots show actual occurrences of the species.
Figure 3: The NMDS plot shows clusters of each species.
Figure 4: Left to right: D. petiolaris, D. stipularis, and D. paleacea. D. petiolaris and D. stipularis share prominent stipules that cover the growth point, while D. petiolaris and D. stipularis both share cupped traps. D. paleacea and D. stipularis share compact growth habit.
Figure 5: Species used for the experiment. All species were compared with a centimeter tape. Clockwise from top left: D. falconeri, D. petiolaris, D. caduca, D. ordensis, D. leucoblasta, D. paleacea. Note the presence of a very prominent stipule in D. leucoblasta; D. falconeri is entering dormancy at the time of the photos.
Figure 6: During Winter, the apical meristem of the sundews in Sect. Bryastrum forms gemmae, which are propelled from the plant when struck by raindrops.
Attachments:
Last edited by hungry carnivores on Tue Dec 08, 2020 11:58 pm, edited 1 time in total.
Nepenthes0260 liked this

 - By MikeB
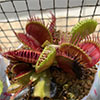 - By stephenboss2000